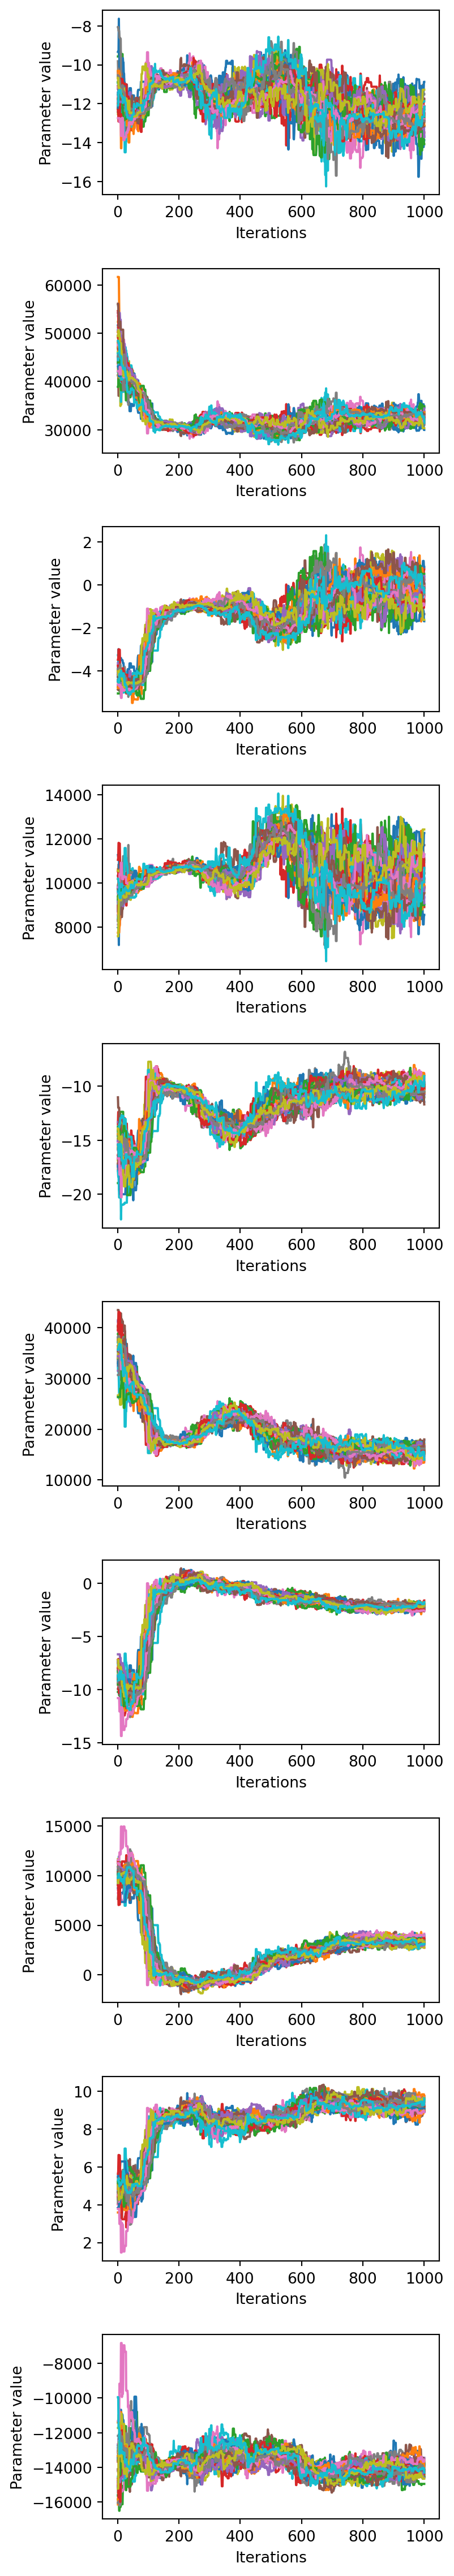
Looking at how each parameter chain evolves across the chains can show if any particular chains are diverging from the rest, if there are multiple modes being explored, or how wide the distribution of parameters are relative to each other.
Each line corresponds to one chain in the ensemble.
import matplotlib.pyplot as pltimport numpy as npfrom espei.analysis import truncate_arrays= np.load('trace.npy' )= np.load('lnprob.npy' )= truncate_arrays(trace, lnprob)= trace.shape[0 ]= trace.shape[2 ]= np.arange(1 ,trace.shape[1 ]+ 1 )= plt.subplots(nrows= num_parameters, gridspec_kw= dict (hspace= 0.4 ), figsize= (4 , 3 * num_parameters))for parameter in range (num_parameters):= axs[parameter]'Iterations' )'Parameter value' )
and if we plot again after 500 iterations of burn-in:
= 500 = plt.subplots(nrows= num_parameters, gridspec_kw= dict (hspace= 0.4 ), figsize= (4 , 3 * num_parameters))for parameter in range (num_parameters):= axs[parameter]'Iterations' )'Parameter value' )