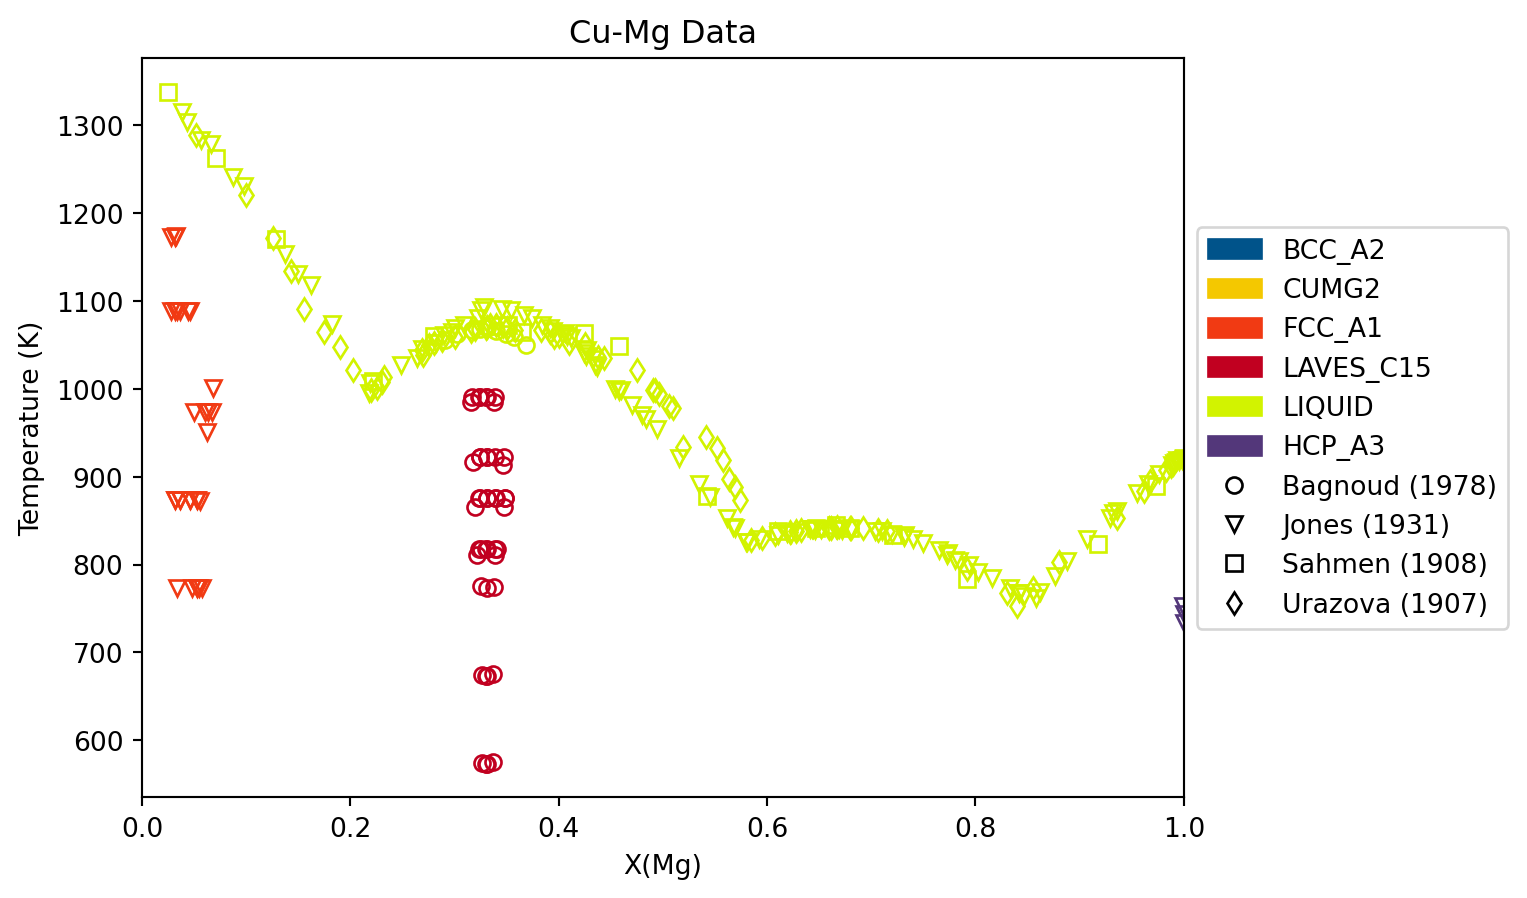
When compiling ESPEI datasets of phase equilibria data, it can be useful to plot the data to check that it matches visually with what you are expecting. This script plots data from a binary phase diagram.
import matplotlib.pyplot as pltfrom pycalphad import variables as vfrom espei.datasets import recursive_glob, load_datasetsfrom espei.plot import dataplot# load datasets from directoryds = load_datasets(recursive_glob("input-data"))components = ["CU", "MG", "VA"]independent_component = components[1]phases = ["BCC_A2", "CUMG2", "FCC_A1", "LAVES_C15", "LIQUID"]# Conditions don't need to have valid values.# Only the keys matter because they are used to search for relevant data.conds = {v.P: 101325, v.T: (1,1,1), v.X(independent_component): (1, 1, 1)}fig, ax = plt.subplots()dataplot(components, phases, conds, ds, ax=ax)ax.set_xlim(0, 1)ax.set_xlabel(f"X({independent_component.capitalize()})")ax.set_ylabel(f"Temperature (K)")ax.set_title("Cu-Mg Data")fig.show()
Plot phase diagram with data
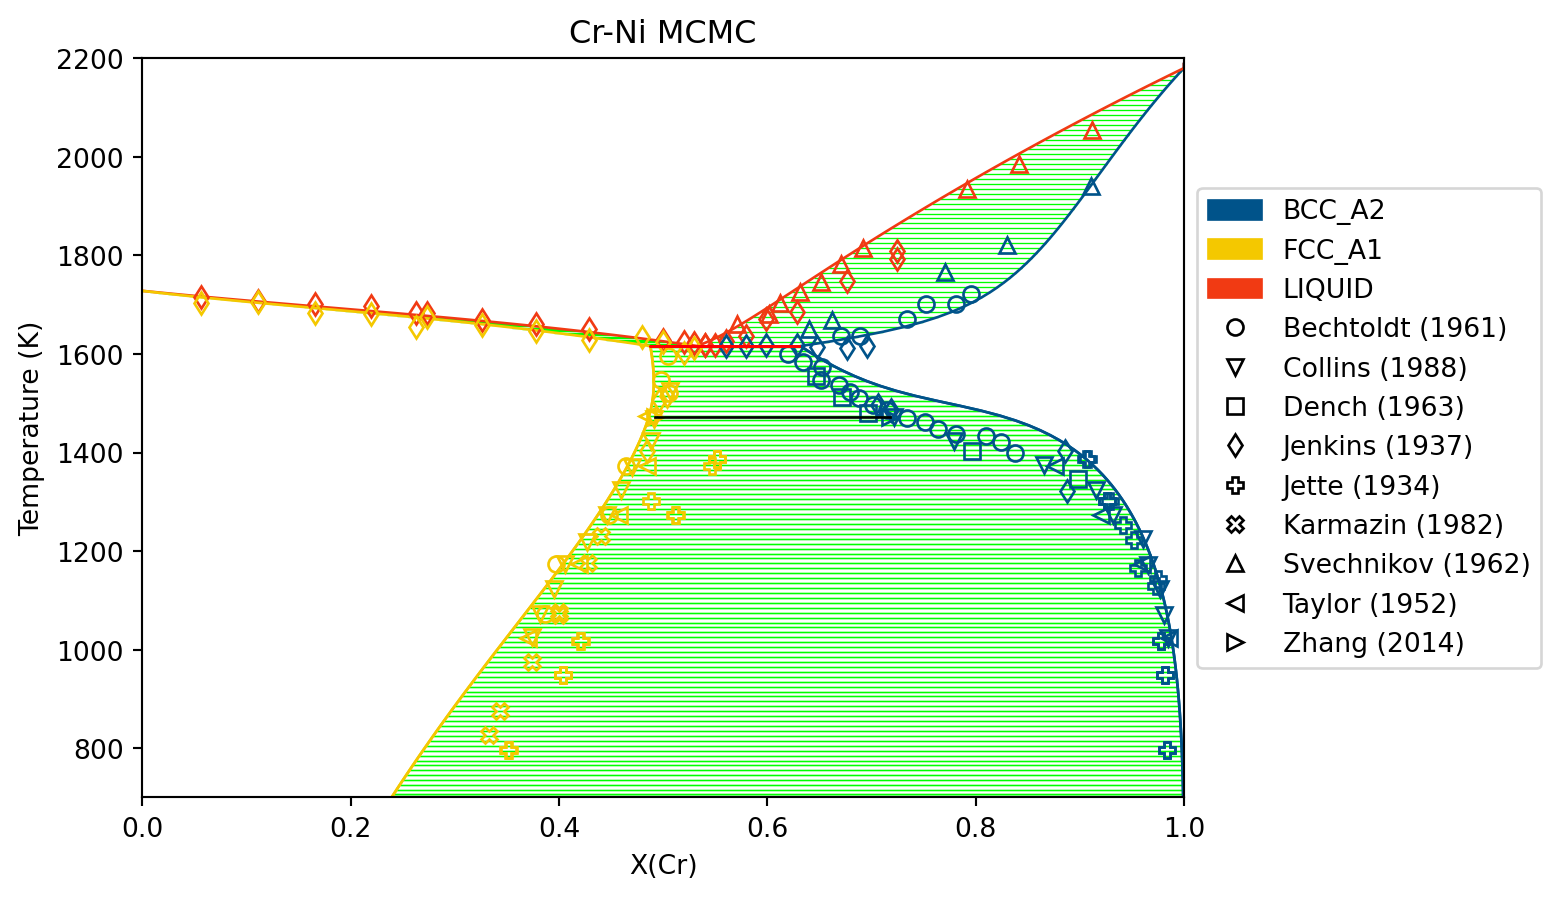
This example uses binplot from PyCalphad and dataplot from ESPEI to plot a phase diagram with the data used to fit it on the same axes.
import matplotlib.pyplot as pltfrom pycalphad import Database, binplot, variables as vfrom espei.datasets import load_datasets, recursive_globfrom espei.plot import dataplot# load datasets from directorydatasets = load_datasets(recursive_glob("input-data"))# set up the pycalphad phase diagram calculationdbf = Database("Cr-Ni_mcmc.tdb")comps = ["CR", "NI", "VA"]phases =list(dbf.phases.keys())conds = {v.P: 101325, v.T: (700, 2200, 10), v.X("CR"): (0, 1, 0.01)}# plot the phase diagram and datafig, ax = plt.subplots()binplot(dbf, comps, phases, conds, plot_kwargs=dict(ax=ax))dataplot(comps, phases, conds, datasets, ax=ax)ax.set_title("Cr-Ni MCMC")ax.set_ylim(conds[v.T][0], conds[v.T][1])ax.set_xlabel("X(Cr)")ax.set_ylabel("Temperature (K)")fig.show()